
US Vegan Climate Index®
- The US Vegan Climate Index (VEGAN), developed by Beyond Investing is a passive, rules- based index of U.S. mainly large cap stocks, screened according to vegan and climate- conscious principles.
- VEGAN excludes companies engaged in animal exploitation, defense, human rights abuses, fossil fuels extraction and energy production, and other environmentally damaging activities. VEGAN includes mid cap stocks that replace companies in sectors that become underweight through their exclusions.
- VEGAN demonstrates that it is possible to obtain broad-based market exposure, whilst adhering to animal and environmentally-friendly principles.
Ticker: .VEGAN
Inception date: 6 June 2018
Inception date: 6 June 2018
Benchmark: S&P500 Index
Calculation agent: Solactive AG
Calculation agent: Solactive AG
Number of stocks
260
Weighted average market cap
$386.4bn
Beta
1.11
Tracking error
6.95%
Excess return
7.99%
(annualised through 30 June 2026)
Live Index Price Performance
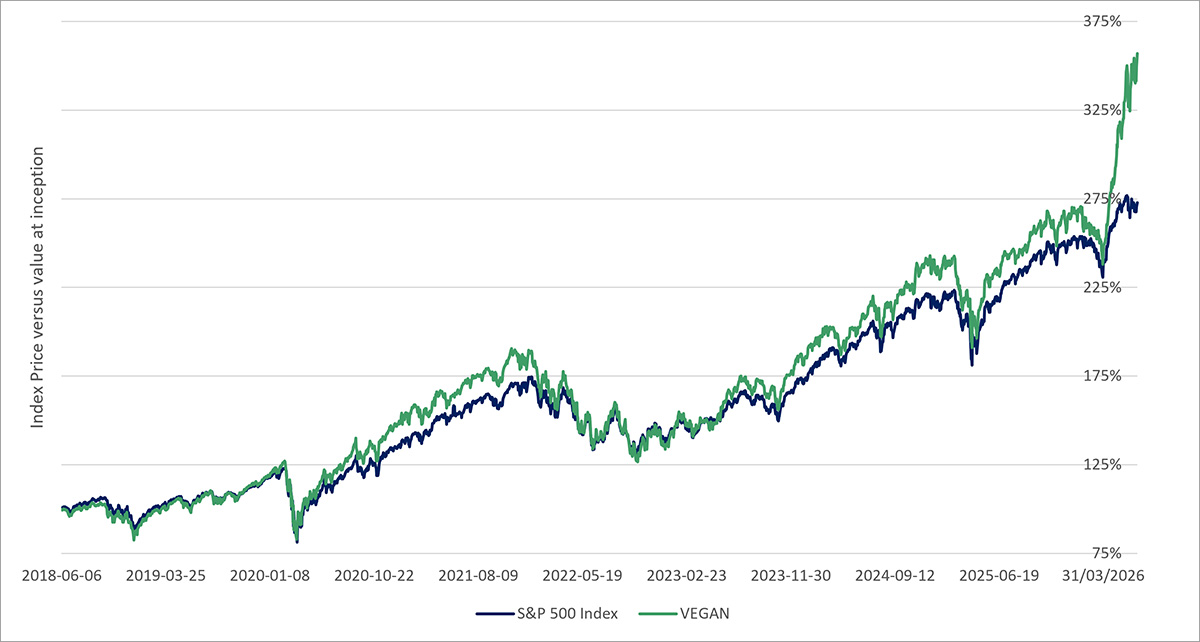
(from 6 June 2018 to 30 June 2026)
Sector Comparison
S&P500
VEGAN
Top 10 Constituents
- Micron Technology Inc – 5.87%
- Advanced Micro Devices – 4.61%
- Applied Materials Inc – 3.95%
- Apple Inc – 3.82%
- LAM Research Corp – 3.64%
- Alphabet Inc Class A – 3.64%
- Broadcom Inc – 3.62%
- Nvidia Corp – 3.58%
- Intel Corp – 3.54%
- Visa Inc. Class A – 3.10%
(as at 30 June 2026)
Breakdown Of Exclusions
- Animal-derived products – 13.58%
- Animal testing – 9.26%
- Military and defense – 8.80%
- Financing of exclusions – 7.81%
- Fossil fuel – 5.12%
- Animals in sport and entertainment – 3.23%
- Energy production from fossil fuel – 2.18%
- Other environmental and human rights – 2.14%
(as at 30 June 2026)
Impact Metrics
| US VEGAN CLIMATE INDEX IMPACT METRICS | |||
|---|---|---|---|
| VEGAN | Benchmark | Based on company reported annual figures | |
| Greenhouse gases | 37.53 | 100.09 | tons of GHG (Scope 1&2) emissions per $1million of revenue |
| Waste generation | 11.45 | 104.63 | tons of waste generated per $1million of revenue |
| Water utilisation | 0.46 | 8.03 | thousand cubic metres per $1million of revenue |
| Enivronmental good | 16.69% | 12.96% | portfolio allocated to environmental solutions |
| Avoiding environmental harm | 0.03% | 4.93% | portfolio allocated to environmentally destructive industries |
| Social good | 6.46% | 9.64% | portfolio allocated to help alleviate social issues |
| Avoiding social harm | 0.02% | 3.54% | portfolio allocated to companies aggravating social issues |
| REAL WORLD EQUIVALENTS | |||
|---|---|---|---|
| As compared to the Benchmark, 1 million USD invested in the Vegan Climate Index Finances: | Relevant SDGs | ||
| Greenhouse gases | 30.15 | less tons of GHG emissions per year | 7, 13, 15 |
| Waste generation | 33.56 | less tons of waste generated per year | 6, 12, 14, 15 |
| Water utilisation | 3.02 | less thousand cubic metres fresh water used per year | 6, 12 |
| Enivronmental good | 3.73% | more invested in industries contributing to environmental solutions | most SDGs |
| Avoiding environmental harm | 4.90% | less invested in industries aggravating environmental problems | most SDGs |
| Social good | 3.18% | less invested in industries helping alleviate social issues | most SDGs |
| Avoiding social harm | 3.53% | less invested in industries aggravating social issues | most SDGs |
Animal Impact
13,000 animals “spared” per $1 million of VEGAN invested in for one year.
The above figure is based on: land animals killed (18 billion), fish caught and farmed (316 billion), egg-laying hens (1.6 billion), dairy cows (64 million) and animals used for testing (28 million).
USA proportion of global annual figures from National Center for Biotechnology Information, GreenFacts, FAOstat
USA proportion of global annual figures from National Center for Biotechnology Information, GreenFacts, FAOstat